dhis2-users team mailing list archive
-
 dhis2-users team
-
Mailing list archive
-
Message #01261
Data visualiser period selection too limited
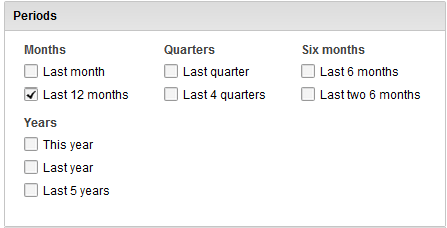
In Rwanda we are trying to use the DHIS-2 platform for a national data warehouse and dashboard.  This stores historical data on selected (key) indicators going back for more than 10 years. Generally the exercise seems to be working well, but we have just noticed an issue regarding the Data Visualizer module:  the period selector tool does not allow us to show data going back that far, and we cannot view more than 12 months of monthly data.

[cid:image001.png@01CD68C7.A2F1F940]

Would it be possible to modify this dialog so that we can give a date range: from 1/1/2005 to 31/12/2011 and then specify whether we want the data disaggregated quarterly, monthly or annually?  Most of our data values are monthly - however we also have entered selected indicators from the DHS (survey data collected every 2 or 3 years).

Thanks,

Randy Wilson
HMIS advisor
MOH Rwanda
Follow ups