dhis2-users team mailing list archive
-
 dhis2-users team
-
Mailing list archive
-
Message #05281
Re: dhis 2.16 upgrade notes
Hi Lars and all,
I used dhis 2.15 for our mental health information system, which contain
both tracker and aggregate parts. I try to upgrade my instance to 2.16 from
2.15. Above mention things has been automatically happened , but there is a
error
1. 2.16 war file deployed on 2.15 database
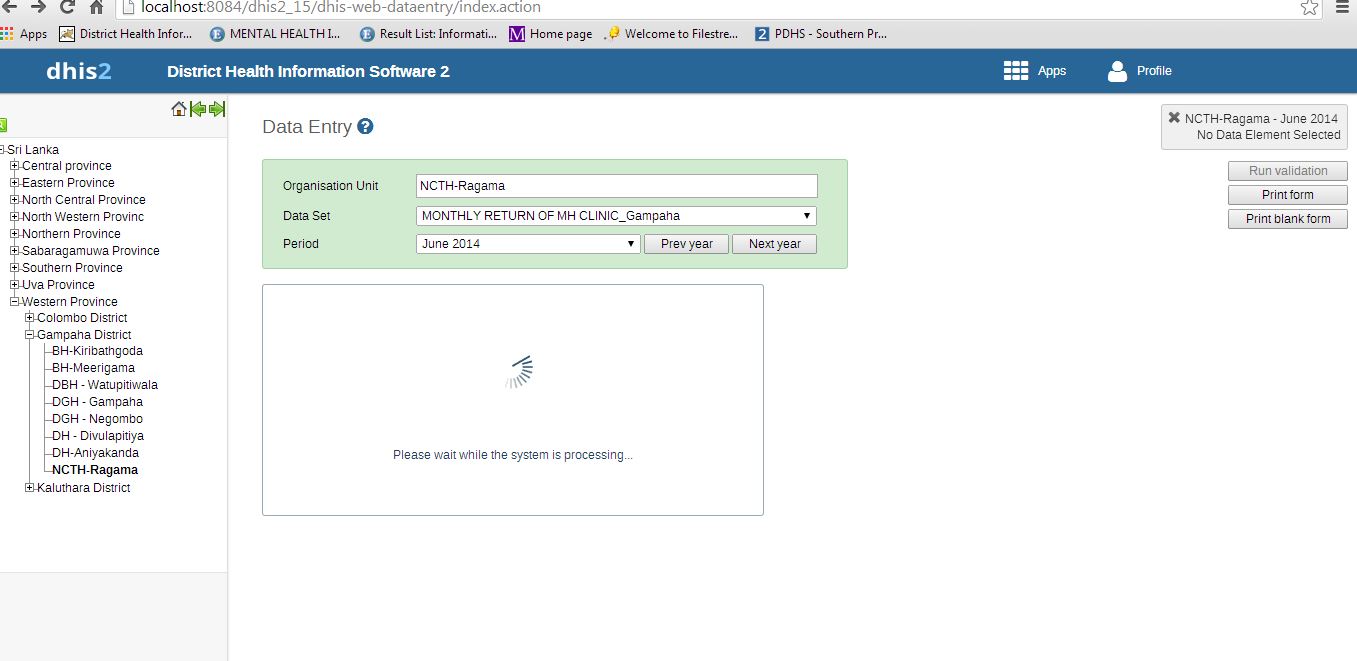
2. then data entry form unable to load
3. give memory problem
Can anyone advise regarding upgrading in to 2.16 ?
Detail of log file and screen shot attach here.
I am using
*Version: 2.16**Build revision:16410**Database type:MySQL*
*Java version:1.7.0_04**OS name:Windows 7*
Regards
Sumudu
On Tue, Aug 5, 2014 at 12:33 AM, Lars Helge Øverland <larshelge@xxxxxxxxx>
wrote:
> Hi,
>
> a note on how to upgrade to dhis version 2.16:
>
> The following changes *require* *action* on the implementer's side.
>
> - From data administration > scheduling, scheduling should be
> deactivated, set according to your needs and finally activated.
> - A property "encryption.password" should be added to
> hibernate.properties file if you plan to use the data synchronization
> feature, see the docs
> <https://www.dhis2.org/doc/snapshot/en/implementer/html/ch08s02.html#d5e505>
> .
>
> The following database changes require *no action* and will happen
> automatically when running the new WAR file the first time.
>
> - Column "completed" of table "programstageinstance" has been removed
> and is replaced by the existing "status" column.
> - The values in column "domaintype" of table "dataelement" have been
> migrated from "aggregate" to "AGGREGATE" and from "patient" to "TRACKER".
> - A column "lastupdated" will be added to table "datavalue", this
> might take some time when starting up the system for the first time.
>
> This information can also be found here:
>
> https://www.dhis2.org/2.16-upgrade
>
> We encourage people to upgrade their instances, test the new features and
> provide feedback.
>
> best regards,
>
> Lars
>
>
> _______________________________________________
> Mailing list: https://launchpad.net/~dhis2-users
> Post to : dhis2-users@xxxxxxxxxxxxxxxxxxx
> Unsubscribe : https://launchpad.net/~dhis2-users
> More help : https://help.launchpad.net/ListHelp
>
>
torBase.java:502)
        at org.apache.catalina.core.StandardHostValve.invoke(StandardHostValve.j
ava:171)
        at org.apache.catalina.valves.ErrorReportValve.invoke(ErrorReportValve.j
ava:100)
        at org.apache.catalina.valves.AccessLogValve.invoke(AccessLogValve.java:
953)
        at org.apache.catalina.core.StandardEngineValve.invoke(StandardEngineVal
ve.java:118)
        at org.apache.catalina.connector.CoyoteAdapter.service(CoyoteAdapter.jav
a:409)
        at org.apache.coyote.http11.AbstractHttp11Processor.process(AbstractHttp
11Processor.java:1044)
        at org.apache.coyote.AbstractProtocol$AbstractConnectionHandler.process(
AbstractProtocol.java:607)
        at org.apache.tomcat.util.net.AprEndpoint$SocketProcessor.doRun(AprEndpo
int.java:2441)
        at org.apache.tomcat.util.net.AprEndpoint$SocketProcessor.run(AprEndpoin
t.java:2430)
        at java.util.concurrent.ThreadPoolExecutor.runWorker(Unknown Source)
        at java.util.concurrent.ThreadPoolExecutor$Worker.run(Unknown Source)
        at java.lang.Thread.run(Unknown Source)
Caused by: java.lang.IllegalArgumentException: No enum constant org.hisp.dhis.ev
ent.EventStatus.0
        at java.lang.Enum.valueOf(Unknown Source)
        at org.hisp.dhis.hibernate.EnumUserType.nullSafeGet(EnumUserType.java:74
)
        at org.hibernate.type.CustomType.nullSafeGet(CustomType.java:127)
        at org.hibernate.type.AbstractType.hydrate(AbstractType.java:106)
        at org.hibernate.persister.entity.AbstractEntityPersister.hydrate(Abstra
ctEntityPersister.java:2903)
        at org.hibernate.loader.Loader.loadFromResultSet(Loader.java:1668)
        at org.hibernate.loader.Loader.instanceNotYetLoaded(Loader.java:1600)
        at org.hibernate.loader.Loader.getRow(Loader.java:1500)
        at org.hibernate.loader.Loader.getRowFromResultSet(Loader.java:712)
        at org.hibernate.loader.Loader.processResultSet(Loader.java:940)
        at org.hibernate.loader.Loader.doQuery(Loader.java:910)
        at org.hibernate.loader.Loader.doQueryAndInitializeNonLazyCollections(Lo
ader.java:341)
        at org.hibernate.loader.Loader.doQueryAndInitializeNonLazyCollections(Lo
ader.java:311)
        at org.hibernate.loader.Loader.loadCollection(Loader.java:2228)
        at org.hibernate.loader.collection.CollectionLoader.initialize(Collectio
nLoader.java:65)
        at org.hibernate.persister.collection.AbstractCollectionPersister.initia
lize(AbstractCollectionPersister.java:674)
        at org.hibernate.event.internal.DefaultInitializeCollectionEventListener
.onInitializeCollection(DefaultInitializeCollectionEventListener.java:80)
        at org.hibernate.internal.SessionImpl.initializeCollection(SessionImpl.j
ava:1848)
        at org.hibernate.collection.internal.AbstractPersistentCollection$4.doWo
rk(AbstractPersistentCollection.java:549)
        at org.hibernate.collection.internal.AbstractPersistentCollection.withTe
mporarySessionIfNeeded(AbstractPersistentCollection.java:234)
        at org.hibernate.collection.internal.AbstractPersistentCollection.initia
lize(AbstractPersistentCollection.java:545)
        at org.hibernate.collection.internal.AbstractPersistentCollection.read(A
bstractPersistentCollection.java:124)
        at org.hibernate.collection.internal.PersistentSet.iterator(PersistentSe
t.java:180)
        at org.hisp.dhis.program.ProgramInstanceDeletionHandler.deleteTrackedEnt
ityInstance(ProgramInstanceDeletionHandler.java:102)
        ... 117 more
* INFO  2014-08-14 07:21:30,150 'admin' delete org.hisp.dhis.trackedentity.Track
edEntityInstance, uid: trCk6GrKX9A (AuditLogUtil.java [http-apr-8084-exec-5])
* WARN  2014-08-14 07:21:30,313 HHH000100: Fail-safe cleanup (collections) : org
.hibernate.engine.loading.internal.CollectionLoadContext@f32292<rs=com.mchange.v
2.c3p0.impl.NewProxyResultSet@1228a73> (LoadContexts.java [http-apr-8084-exec-5]
)
* WARN  2014-08-14 07:21:30,314 HHH000160: On CollectionLoadContext#cleanup, loc
alLoadingCollectionKeys contained [1] entries (CollectionLoadContext.java [http-
apr-8084-exec-5])
Aug 14, 2014 7:21:55 AM com.hazelcast.util.HealthMonitor
INFO: [10.111.111.30]:5701 [dev] [3.2.1] memory.used=390.7M, memory.free=104.2M,
 memory.total=494.9M, memory.max=494.9M, memory.used/total=78.94%, memory.used/m
ax=78.94%, load.process=-100.00%, load.system=-100.00%, load.systemAverage=-100.
00%, thread.count=57, thread.peakCount=57, event.q.size=0, executor.q.async.size
=0, executor.q.client.size=0, executor.q.operation.size=0, executor.q.query.size
=0, executor.q.scheduled.size=0, executor.q.io.size=0, executor.q.system.size=0,
 executor.q.operation.size=0, executor.q.priorityOperation.size=0, executor.q.re
sponse.size=0, operations.remote.size=0, operations.running.size=0, proxy.count=
195, clientEndpoint.count=0, connection.active.count=0, connection.count=0
Aug 14, 2014 7:22:25 AM com.hazelcast.util.HealthMonitor
INFO: [10.111.111.30]:5701 [dev] [3.2.1] memory.used=390.8M, memory.free=104.1M,
 memory.total=494.9M, memory.max=494.9M, memory.used/total=78.97%, memory.used/m
ax=78.97%, load.process=-100.00%, load.system=-100.00%, load.systemAverage=-100.
00%, thread.count=57, thread.peakCount=57, event.q.size=0, executor.q.async.size
=0, executor.q.client.size=0, executor.q.operation.size=0, executor.q.query.size
=0, executor.q.scheduled.size=0, executor.q.io.size=0, executor.q.system.size=0,
 executor.q.operation.size=0, executor.q.priorityOperation.size=0, executor.q.re
sponse.size=0, operations.remote.size=0, operations.running.size=0, proxy.count=
195, clientEndpoint.count=0, connection.active.count=0, connection.count=0
Aug 14, 2014 7:22:55 AM com.hazelcast.util.HealthMonitor
INFO: [10.111.111.30]:5701 [dev] [3.2.1] memory.used=391.0M, memory.free=103.9M,
 memory.total=494.9M, memory.max=494.9M, memory.used/total=79.00%, memory.used/m
ax=79.00%, load.process=-100.00%, load.system=-100.00%, load.systemAverage=-100.
00%, thread.count=57, thread.peakCount=57, event.q.size=0, executor.q.async.size
=0, executor.q.client.size=0, executor.q.operation.size=0, executor.q.query.size
=0, executor.q.scheduled.size=0, executor.q.io.size=0, executor.q.system.size=0,
 executor.q.operation.size=0, executor.q.priorityOperation.size=0, executor.q.re
sponse.size=0, operations.remote.size=0, operations.running.size=0, proxy.count=
195, clientEndpoint.count=0, connection.active.count=0, connection.count=0
Aug 14, 2014 7:23:25 AM com.hazelcast.util.HealthMonitor
INFO: [10.111.111.30]:5701 [dev] [3.2.1] memory.used=391.1M, memory.free=103.8M,
 memory.total=494.9M, memory.max=494.9M, memory.used/total=79.03%, memory.used/m
ax=79.03%, load.process=-100.00%, load.system=-100.00%, load.systemAverage=-100.
00%, thread.count=57, thread.peakCount=57, event.q.size=0, executor.q.async.size
=0, executor.q.client.size=0, executor.q.operation.size=0, executor.q.query.size
=0, executor.q.scheduled.size=0, executor.q.io.size=0, executor.q.system.size=0,
 executor.q.operation.size=0, executor.q.priorityOperation.size=0, executor.q.re
sponse.size=0, operations.remote.size=0, operations.running.size=0, proxy.count=
195, clientEndpoint.count=0, connection.active.count=0, connection.count=0
Aug 14, 2014 7:23:55 AM com.hazelcast.util.HealthMonitor
INFO: [10.111.111.30]:5701 [dev] [3.2.1] memory.used=391.3M, memory.free=103.7M,
 memory.total=494.9M, memory.max=494.9M, memory.used/total=79.06%, memory.used/m
ax=79.06%, load.process=-100.00%, load.system=-100.00%, load.systemAverage=-100.
00%, thread.count=57, thread.peakCount=57, event.q.size=0, executor.q.async.size
=0, executor.q.client.size=0, executor.q.operation.size=0, executor.q.query.size
=0, executor.q.scheduled.size=0, executor.q.io.size=0, executor.q.system.size=0,
 executor.q.operation.size=0, executor.q.priorityOperation.size=0, executor.q.re
sponse.size=0, operations.remote.size=0, operations.running.size=0, proxy.count=
195, clientEndpoint.count=0, connection.active.count=0, connection.count=0
Aug 14, 2014 7:24:25 AM com.hazelcast.util.HealthMonitor
INFO: [10.111.111.30]:5701 [dev] [3.2.1] memory.used=391.4M, memory.free=103.5M,
 memory.total=494.9M, memory.max=494.9M, memory.used/total=79.09%, memory.used/m
ax=79.09%, load.process=-100.00%, load.system=-100.00%, load.systemAverage=-100.
00%, thread.count=57, thread.peakCount=57, event.q.size=0, executor.q.async.size
=0, executor.q.client.size=0, executor.q.operation.size=0, executor.q.query.size
=0, executor.q.scheduled.size=0, executor.q.io.size=0, executor.q.system.size=0,
 executor.q.operation.size=0, executor.q.priorityOperation.size=0, executor.q.re
sponse.size=0, operations.remote.size=0, operations.running.size=0, proxy.count=
195, clientEndpoint.count=0, connection.active.count=0, connection.count=0
Aug 14, 2014 7:24:55 AM com.hazelcast.util.HealthMonitor
INFO: [10.111.111.30]:5701 [dev] [3.2.1] memory.used=391.6M, memory.free=103.4M,
 memory.total=494.9M, memory.max=494.9M, memory.used/total=79.12%, memory.used/m
ax=79.12%, load.process=-100.00%, load.system=-100.00%, load.systemAverage=-100.
00%, thread.count=57, thread.peakCount=57, event.q.size=0, executor.q.async.size
=0, executor.q.client.size=0, executor.q.operation.size=0, executor.q.query.size
=0, executor.q.scheduled.size=0, executor.q.io.size=0, executor.q.system.size=0,
 executor.q.operation.size=0, executor.q.priorityOperation.size=0, executor.q.re
sponse.size=0, operations.remote.size=0, operations.running.size=0, proxy.count=
195, clientEndpoint.count=0, connection.active.count=0, connection.count=0
Aug 14, 2014 7:25:25 AM com.hazelcast.util.HealthMonitor
INFO: [10.111.111.30]:5701 [dev] [3.2.1] memory.used=391.7M, memory.free=103.2M,
 memory.total=494.9M, memory.max=494.9M, memory.used/total=79.15%, memory.used/m
ax=79.15%, load.process=-100.00%, load.system=-100.00%, load.systemAverage=-100.
00%, thread.count=57, thread.peakCount=57, event.q.size=0, executor.q.async.size
=0, executor.q.client.size=0, executor.q.operation.size=0, executor.q.query.size
=0, executor.q.scheduled.size=0, executor.q.io.size=0, executor.q.system.size=0,
 executor.q.operation.size=0, executor.q.priorityOperation.size=0, executor.q.re
sponse.size=0, operations.remote.size=0, operations.running.size=0, proxy.count=
195, clientEndpoint.count=0, connection.active.count=0, connection.count=0
Aug 14, 2014 7:25:55 AM com.hazelcast.util.HealthMonitor
INFO: [10.111.111.30]:5701 [dev] [3.2.1] memory.used=391.9M, memory.free=103.1M,
 memory.total=494.9M, memory.max=494.9M, memory.used/total=79.18%, memory.used/m
ax=79.18%, load.process=-100.00%, load.system=-100.00%, load.systemAverage=-100.
00%, thread.count=57, thread.peakCount=57, event.q.size=0, executor.q.async.size
=0, executor.q.client.size=0, executor.q.operation.size=0, executor.q.query.size
=0, executor.q.scheduled.size=0, executor.q.io.size=0, executor.q.system.size=0,
 executor.q.operation.size=0, executor.q.priorityOperation.size=0, executor.q.re
sponse.size=0, operations.remote.size=0, operations.running.size=0, proxy.count=
195, clientEndpoint.count=0, connection.active.count=0, connection.count=0
Aug 14, 2014 7:26:25 AM com.hazelcast.util.HealthMonitor
INFO: [10.111.111.30]:5701 [dev] [3.2.1] memory.used=392.0M, memory.free=102.9M,
 memory.total=494.9M, memory.max=494.9M, memory.used/total=79.21%, memory.used/m
ax=79.21%, load.process=-100.00%, load.system=-100.00%, load.systemAverage=-100.
00%, thread.count=57, thread.peakCount=57, event.q.size=0, executor.q.async.size
=0, executor.q.client.size=0, executor.q.operation.size=0, executor.q.query.size
=0, executor.q.scheduled.size=0, executor.q.io.size=0, executor.q.system.size=0,
 executor.q.operation.size=0, executor.q.priorityOperation.size=0, executor.q.re
sponse.size=0, operations.remote.size=0, operations.running.size=0, proxy.count=
195, clientEndpoint.count=0, connection.active.count=0, connection.count=0
Aug 14, 2014 7:27:25 AM com.hazelcast.util.HealthMonitor
INFO: [10.111.111.30]:5701 [dev] [3.2.1] memory.used=355.2M, memory.free=139.8M,
 memory.total=494.9M, memory.max=494.9M, memory.used/total=71.76%, memory.used/m
ax=71.76%, load.process=-100.00%, load.system=-100.00%, load.systemAverage=-100.
00%, thread.count=57, thread.peakCount=57, event.q.size=0, executor.q.async.size
=0, executor.q.client.size=0, executor.q.operation.size=0, executor.q.query.size
=0, executor.q.scheduled.size=0, executor.q.io.size=0, executor.q.system.size=0,
 executor.q.operation.size=0, executor.q.priorityOperation.size=0, executor.q.re
sponse.size=0, operations.remote.size=0, operations.running.size=0, proxy.count=
195, clientEndpoint.count=0, connection.active.count=0, connection.count=0
Aug 14, 2014 7:27:55 AM com.hazelcast.util.HealthMonitor
INFO: [10.111.111.30]:5701 [dev] [3.2.1] memory.used=375.4M, memory.free=119.6M,
 memory.total=494.9M, memory.max=494.9M, memory.used/total=75.84%, memory.used/m
ax=75.84%, load.process=-100.00%, load.system=-100.00%, load.systemAverage=-100.
00%, thread.count=57, thread.peakCount=57, event.q.size=0, executor.q.async.size
=0, executor.q.client.size=0, executor.q.operation.size=0, executor.q.query.size
=0, executor.q.scheduled.size=0, executor.q.io.size=0, executor.q.system.size=0,
 executor.q.operation.size=0, executor.q.priorityOperation.size=0, executor.q.re
sponse.size=0, operations.remote.size=0, operations.running.size=0, proxy.count=
195, clientEndpoint.count=0, connection.active.count=0, connection.count=0
Aug 14, 2014 7:28:25 AM com.hazelcast.util.HealthMonitor
INFO: [10.111.111.30]:5701 [dev] [3.2.1] memory.used=380.1M, memory.free=114.9M,
 memory.total=494.9M, memory.max=494.9M, memory.used/total=76.79%, memory.used/m
ax=76.79%, load.process=-100.00%, load.system=-100.00%, load.systemAverage=-100.
00%, thread.count=57, thread.peakCount=57, event.q.size=0, executor.q.async.size
=0, executor.q.client.size=0, executor.q.operation.size=0, executor.q.query.size
=0, executor.q.scheduled.size=0, executor.q.io.size=0, executor.q.system.size=0,
 executor.q.operation.size=0, executor.q.priorityOperation.size=0, executor.q.re
sponse.size=0, operations.remote.size=0, operations.running.size=0, proxy.count=
195, clientEndpoint.count=0, connection.active.count=0, connection.count=0
Aug 14, 2014 7:28:55 AM com.hazelcast.util.HealthMonitor
INFO: [10.111.111.30]:5701 [dev] [3.2.1] memory.used=384.9M, memory.free=110.0M,
 memory.total=494.9M, memory.max=494.9M, memory.used/total=77.77%, memory.used/m
ax=77.77%, load.process=-100.00%, load.system=-100.00%, load.systemAverage=-100.
00%, thread.count=57, thread.peakCount=57, event.q.size=0, executor.q.async.size
=0, executor.q.client.size=0, executor.q.operation.size=0, executor.q.query.size
=0, executor.q.scheduled.size=0, executor.q.io.size=0, executor.q.system.size=0,
 executor.q.operation.size=0, executor.q.priorityOperation.size=0, executor.q.re
sponse.size=0, operations.remote.size=0, operations.running.size=0, proxy.count=
195, clientEndpoint.count=0, connection.active.count=0, connection.count=0
Aug 14, 2014 7:29:29 AM com.hazelcast.util.HealthMonitor
INFO: [10.111.111.30]:5701 [dev] [3.2.1] memory.used=389.8M, memory.free=105.1M,
 memory.total=494.9M, memory.max=494.9M, memory.used/total=78.76%, memory.used/m
ax=78.76%, load.process=-100.00%, load.system=-100.00%, load.systemAverage=-100.
00%, thread.count=57, thread.peakCount=57, event.q.size=0, executor.q.async.size
=0, executor.q.client.size=0, executor.q.operation.size=0, executor.q.query.size
=0, executor.q.scheduled.size=0, executor.q.io.size=0, executor.q.system.size=0,
 executor.q.operation.size=0, executor.q.priorityOperation.size=0, executor.q.re
sponse.size=0, operations.remote.size=0, operations.running.size=0, proxy.count=
195, clientEndpoint.count=0, connection.active.count=0, connection.count=0
Aug 14, 2014 7:29:59 AM com.hazelcast.util.HealthMonitor
INFO: [10.111.111.30]:5701 [dev] [3.2.1] memory.used=394.4M, memory.free=100.5M,
 memory.total=494.9M, memory.max=494.9M, memory.used/total=79.69%, memory.used/m
ax=79.69%, load.process=-100.00%, load.system=-100.00%, load.systemAverage=-100.
00%, thread.count=57, thread.peakCount=57, event.q.size=0, executor.q.async.size
=0, executor.q.client.size=0, executor.q.operation.size=0, executor.q.query.size
=0, executor.q.scheduled.size=0, executor.q.io.size=0, executor.q.system.size=0,
 executor.q.operation.size=0, executor.q.priorityOperation.size=0, executor.q.re
sponse.size=0, operations.remote.size=0, operations.running.size=0, proxy.count=
195, clientEndpoint.count=0, connection.active.count=0, connection.count=0
Aug 14, 2014 7:30:29 AM com.hazelcast.util.HealthMonitor
INFO: [10.111.111.30]:5701 [dev] [3.2.1] memory.used=398.8M, memory.free=96.1M,
memory.total=494.9M, memory.max=494.9M, memory.used/total=80.59%, memory.used/ma
x=80.59%, load.process=-100.00%, load.system=-100.00%, load.systemAverage=-100.0
0%, thread.count=57, thread.peakCount=57, event.q.size=0, executor.q.async.size=
0, executor.q.client.size=0, executor.q.operation.size=0, executor.q.query.size=
0, executor.q.scheduled.size=0, executor.q.io.size=0, executor.q.system.size=0,
executor.q.operation.size=0, executor.q.priorityOperation.size=0, executor.q.res
ponse.size=0, operations.remote.size=0, operations.running.size=0, proxy.count=1
95, clientEndpoint.count=0, connection.active.count=0, connection.count=0
Aug 14, 2014 7:30:59 AM com.hazelcast.util.HealthMonitor
INFO: [10.111.111.30]:5701 [dev] [3.2.1] memory.used=403.3M, memory.free=91.7M,
memory.total=494.9M, memory.max=494.9M, memory.used/total=81.48%, memory.used/ma
x=81.48%, load.process=-100.00%, load.system=-100.00%, load.systemAverage=-100.0
0%, thread.count=57, thread.peakCount=57, event.q.size=0, executor.q.async.size=
0, executor.q.client.size=0, executor.q.operation.size=0, executor.q.query.size=
0, executor.q.scheduled.size=0, executor.q.io.size=0, executor.q.system.size=0,
executor.q.operation.size=0, executor.q.priorityOperation.size=0, executor.q.res
ponse.size=0, operations.remote.size=0, operations.running.size=0, proxy.count=1
95, clientEndpoint.count=0, connection.active.count=0, connection.count=0
Aug 14, 2014 7:31:29 AM com.hazelcast.util.HealthMonitor
INFO: [10.111.111.30]:5701 [dev] [3.2.1] memory.used=411.8M, memory.free=83.2M,
memory.total=494.9M, memory.max=494.9M, memory.used/total=83.20%, memory.used/ma
x=83.20%, load.process=-100.00%, load.system=-100.00%, load.systemAverage=-100.0
0%, thread.count=57, thread.peakCount=57, event.q.size=0, executor.q.async.size=
0, executor.q.client.size=0, executor.q.operation.size=0, executor.q.query.size=
0, executor.q.scheduled.size=0, executor.q.io.size=0, executor.q.system.size=0,
executor.q.operation.size=0, executor.q.priorityOperation.size=0, executor.q.res
ponse.size=0, operations.remote.size=0, operations.running.size=0, proxy.count=1
95, clientEndpoint.count=0, connection.active.count=0, connection.count=0
Aug 14, 2014 7:32:35 AM org.apache.catalina.startup.HostConfig undeploy
INFO: Undeploying context [/dhis2_15]
* INFO  2014-08-14 07:32:35,679 De-registering jdbc driver: sun.jdbc.odbc.JdbcOd
bcDriver@16d3fde (StartupListener.java [ContainerBackgroundProcessor[StandardEng
ine[Catalina]]])
* INFO  2014-08-14 07:32:35,679 De-registering jdbc driver: com.mysql.jdbc.Drive
r@12286 (StartupListener.java [ContainerBackgroundProcessor[StandardEngine[Catal
ina]]])
Aug 14, 2014 7:32:35 AM com.hazelcast.hibernate.HazelcastLocalCacheRegionFactory

INFO: Shutting down HazelcastLocalCacheRegionFactory
Aug 14, 2014 7:32:35 AM com.hazelcast.core.LifecycleService
INFO: [10.111.111.30]:5701 [dev] [3.2.1] Address[10.111.111.30]:5701 is SHUTTING
_DOWN
Aug 14, 2014 7:32:35 AM com.hazelcast.initializer
INFO: [10.111.111.30]:5701 [dev] [3.2.1] Destroying node initializer.
Aug 14, 2014 7:32:35 AM com.hazelcast.instance.Node
INFO: [10.111.111.30]:5701 [dev] [3.2.1] Hazelcast Shutdown is completed in 22 m
s.
Aug 14, 2014 7:32:35 AM com.hazelcast.core.LifecycleService
INFO: [10.111.111.30]:5701 [dev] [3.2.1] Address[10.111.111.30]:5701 is SHUTDOWN

Aug 14, 2014 7:32:35 AM org.apache.catalina.loader.WebappClassLoader clearRefere
ncesThreads
SEVERE: The web application [/dhis2_15] appears to have started a thread named [
Abandoned connection cleanup thread] but has failed to stop it. This is very lik
ely to create a memory leak.
Aug 14, 2014 7:32:35 AM org.apache.catalina.loader.WebappClassLoader clearRefere
ncesThreads
SEVERE: The web application [/dhis2_15] appears to have started a thread named [
GT authority factory disposer] but has failed to stop it. This is very likely to
 create a memory leak.
Aug 14, 2014 7:32:35 AM org.apache.catalina.loader.WebappClassLoader clearRefere
ncesThreads
SEVERE: The web application [/dhis2_15] appears to have started a thread named [
WeakCollectionCleaner] but has failed to stop it. This is very likely to create
a memory leak.
Attachment:
data entry form.JPG
Description: JPEG image
Follow ups
References