dhis2-users team mailing list archive
-
 dhis2-users team
-
Mailing list archive
-
Message #07005
Re: Different representations of thematic layers
Hi Johan,
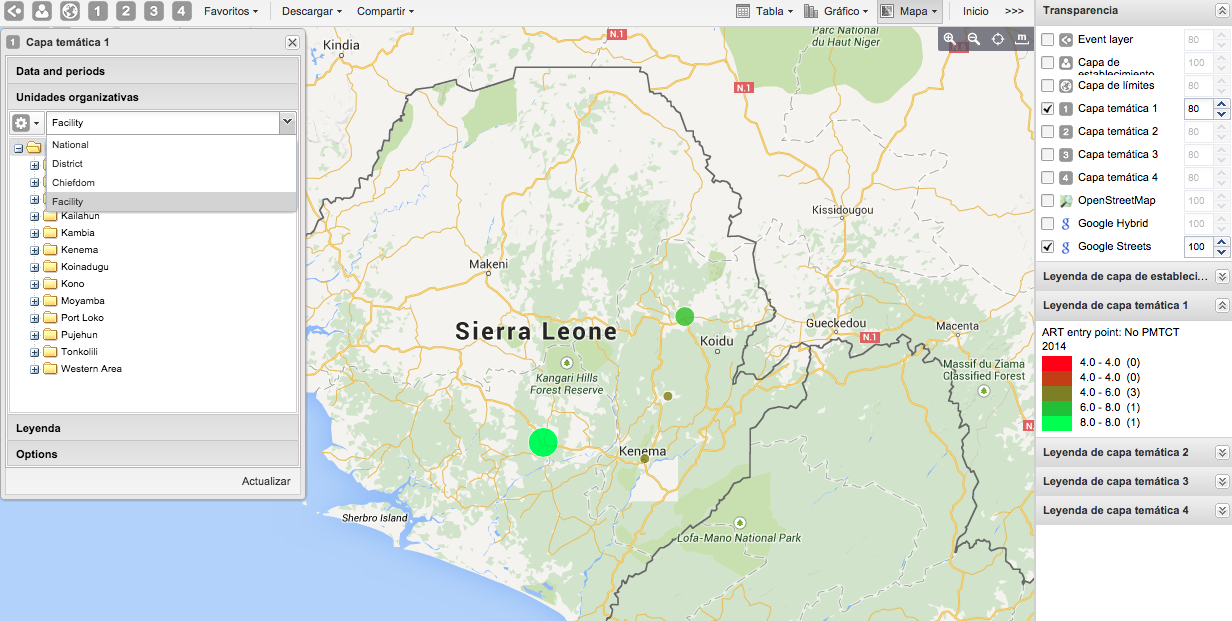
What you want is actually there and once you have facility/site Coordinates
for a facility you will be able to achieve this both by colour and circle
size of the data being mapped.
Under Orgunit Level, select the facility/site group
See below
[image: Inline image 1]
Regards
On Thu, Apr 23, 2015 at 12:50 PM, Johan Ivar Sæbø <johansa@xxxxxxxxxx>
wrote:
> Hi,
>
> as far as I can understand, all thematic layers in the GIS app will
> represent data by colouring the area of the selected organizational level.
> Is it possible to select other ways of representation, like a circle of
> various size (similar to the facility layer representation)? A use case
> would be:
> - Layer 1 showing data completeness by district
> - Layer 2 with cases of cholera by district
>
> It becomes difficult to see both well at the same time, even with clever
> use of transparency of the layers. It would be helpful to have for instance
> the data completeness as a background colour, and the cases of cholera as
> circles of varying size and/or colour. In general, looking at size of a
> circle may be more powerful when looking at the presence and epicentres of
> epidemic outbreaks, but in the West African regional db there is no
> facility layer. All data is collected for the respective countries' third
> level (National-level 2-level 3)
>
> Regards,
> Johan
>
> _______________________________________________
> Mailing list: https://launchpad.net/~dhis2-users
> Post to : dhis2-users@xxxxxxxxxxxxxxxxxxx
> Unsubscribe : https://launchpad.net/~dhis2-users
> More help : https://help.launchpad.net/ListHelp
>
--
Prosper Behumbiize, MPH
Phone: +256 414 320076
Cell: +256 772 139037
+256 752 751776
Follow ups
References