dhis2-users team mailing list archive
-
 dhis2-users team
-
Mailing list archive
-
Message #08648
Re: R and the web API
Dear Eric,

Something like this  should assist to generate the metadata
http://YOUR_URLl/api/organisationUnits.json?paging=false&fields=id,name,parent[id,name,parent[id,name,parent[id,name]]]&filter=level:EQ:5


The above will generate the orgunit hierachy at level 5 (lowest level) up
to level 2. Note how I use the parent[id,name]

Alex

On Mon, Nov 23, 2015 at 5:35 PM, Eric Green <epgreen@xxxxxxxxx> wrote:

> I had a side conversation with Jason Pickering about using R to access the
> web API, and I’m moving the conversation to the mailing list to document it
> for others.
>
> I asked Jason for guidance on modifying the API url to import data into R.
> Prior to contacting Jason, I reviewed this documentation
> <https://www.dhis2.org/doc/snapshot/en/developer/html/apas07.html> and his
> presentation <https://github.com/jason-p-pickering/dhis2RIntegration> on
> R/DHIS2 integration (great stuff!). Jason was nice enough to create this
> example <http://www.r-fiddle.org/#/fiddle?id=wHglXleC&version=1> that
> showed me how to use the pivot table app, copy the API url using
> Firefox/Chrome developer tools, and use the pre-filled URL in R as a
> template.
>
> I wanted to do more with organization units, so I modified Jason’s example
> here: https://gist.github.com/ericpgreen/bb7fcb55efd8c93d3451.
>
> I might not be approaching the problem the right way, but my general
> approach is to define a set of periods (monthly) and organizational units
> and then loop over a set of indicators to create a data frame for each
> indicator that has values by unit (row) and period (column). Then in R (not
> shown), I will transform each data frame from wide to long and then combine
> the data frames for each indicator into a larger data frame for analysis.
>
> I would like to have the data at the lowest level possible so I can later
> aggregate at higher organization unit levels (e.g., counties) and periods
> (e.g., years) as needed. I know I could just request these aggregations via
> the API, but I am accustomed to working with datasets at the lowest level
> and doing manipulations in my code so I can follow the process more closely
> (I’m new to APIs).
>
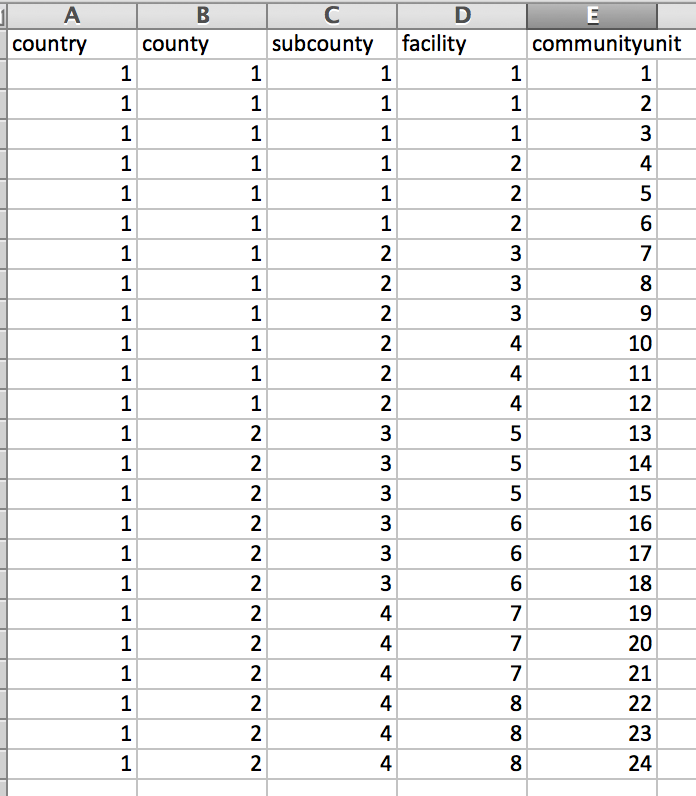
> *My current question is how to obtain the metadata that indicates the
> organizational hierarchy of units.* When I define urlD in my code, I’d
> like to automatically grab all facility OU’s where county==2, for instance.
> I know I could do this if I had something like the following table. Right
> now I specify each OU manually. Having this table would allow me to build
> the API url programmatically.
>
> Also, in the data frame that is created, I only know that an observation
> is linked to facility 5, for instance, but I don’t have the metadata to
> show that facility 5 is in sub county 3 which is in county 2 of country 1.
> So having this table would let me aggregate on my end later.
>
> Of course suggestions on improving my general approach are also welcome!!
>
>
>
>
>
>
> _______________________________________________
> Mailing list: https://launchpad.net/~dhis2-users
> Post to     : dhis2-users@xxxxxxxxxxxxxxxxxxx
> Unsubscribe : https://launchpad.net/~dhis2-users
> More help   : https://help.launchpad.net/ListHelp
>
>


--
Alex Tumwesigye

Technical Advisor - DHIS2 (Consultant),
Ministry of Health/AFENET
Kampala
Uganda

IT Consultant - BarefootPower Uganda Ltd, SmartSolar, Kenya

IT Specialist (Servers, Networks and Security, Health Information Systems -
DHIS2 ) & Solar Consultant

+256 774149 775, + 256 759 800161

"I don't want to be anything other than what I have been - one tree hill "

Follow ups
References