dhis2-users team mailing list archive
-
 dhis2-users team
-
Mailing list archive
-
Message #13325
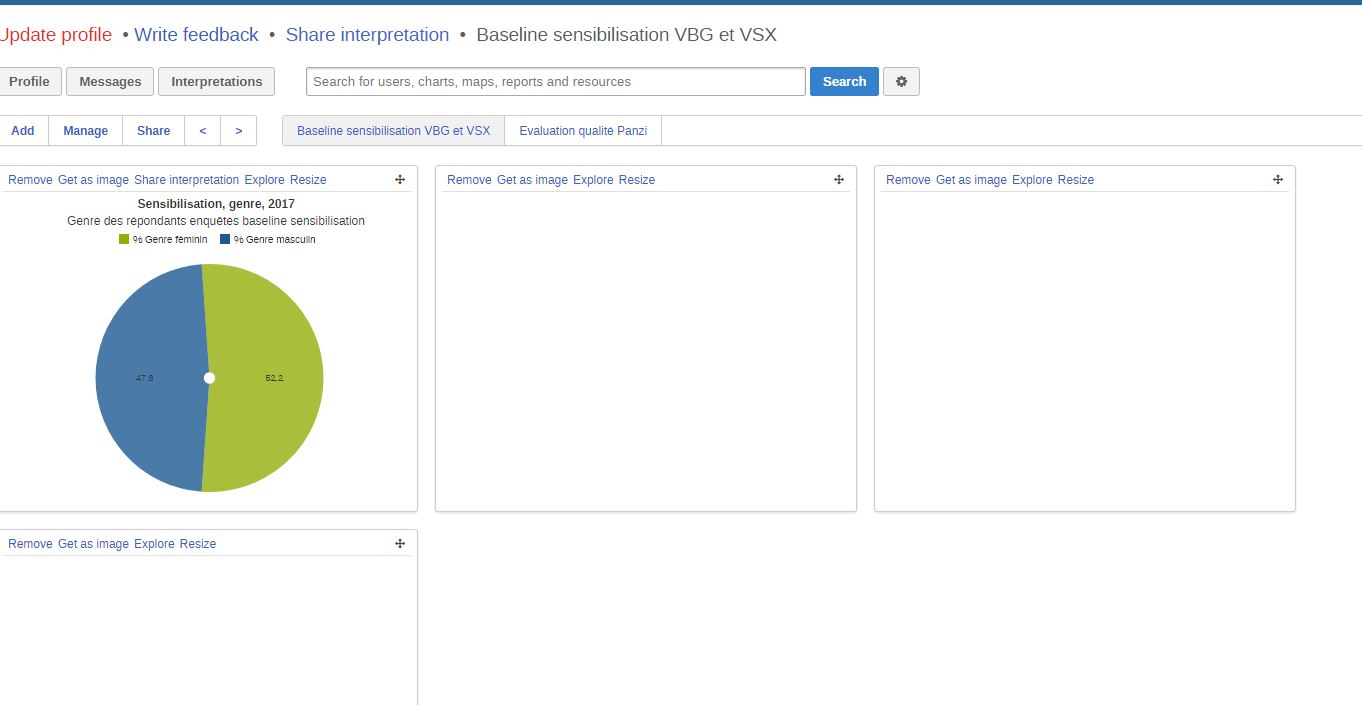
[Event graphs or event pivots tables appear as blank in my dashboard]
Hi DHIS2 community members,

I created graphs with the *event reporter* and *event visualizer app*.
To create those graphs, I used data element. I saved those graphs and add
them in a dashboard.

My problem is that in my dashboard I only see* a blank frame instead of the
graph* (see screenshot in attachment). When I click on the button
"Explore", I go to my saved graph and I can see it.

The only graph that I can see in my dasboard is one that I created trough
the Data visualizer app using indicators.

Why can I not see my graphs (from event reporter or event visualizer apps)
in my dashboard and how can I fix it?

Thanks


Julie Vanhamme
Attachment:
Capture3.JPG
Description: JPEG image
Follow ups