dhis2-users team mailing list archive
-
 dhis2-users team
-
Mailing list archive
-
Message #15341
Re: Automatic aggregation of lower org units
Dear Alison
There are few causes for this.

First of all, check whether you put any aggregation level for these data
element or not. If so, correct/remove it by editing data elements. If that
is not the case, we may may look for other causes.

*Nayeem Al Mifthah*
*Consultant for HSS, Health MIS, M&E and Surveillance*
Email: n.mifthah@xxxxxxxxx
Cell:+8801914030574
Skype: nayeem.a.m

On Tue, Mar 6, 2018 at 9:53 AM, Alison Perez <perez.alison@xxxxxxxxx> wrote:

> Good day DHIS2 Community,
>
> I have a DHIS2 organization unit wherein data is entered per municipality
> on a per month basis. Municipalities are group based on their respective
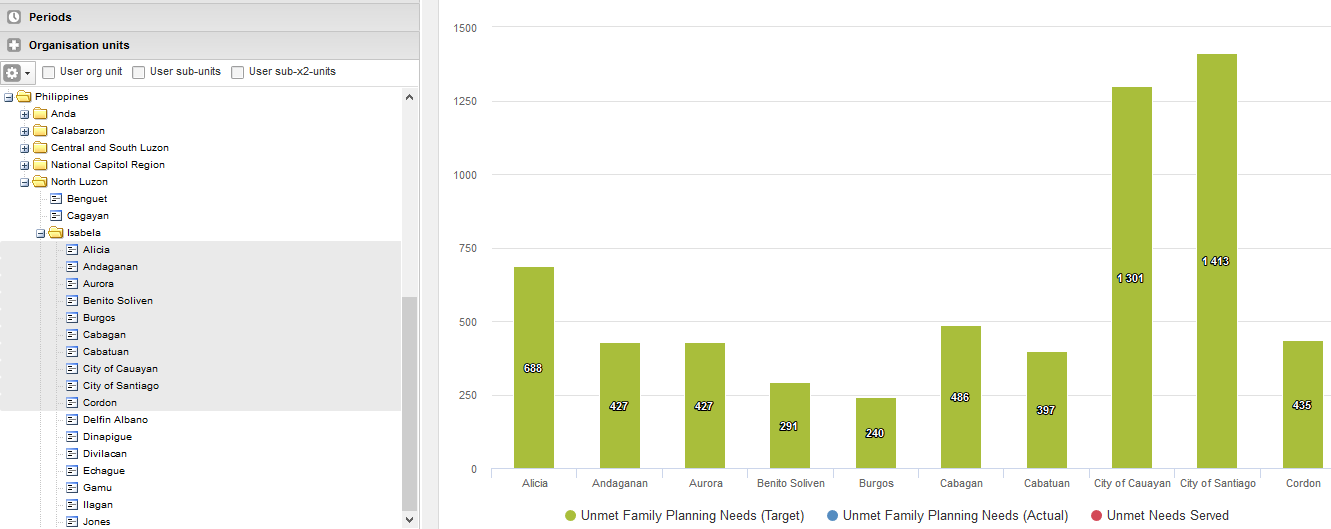
> provinces. When generating the per municipality bar graph in Data
> Visualization, data is displayed perfectly (see graph below)
>
>
>
>
>
>
>
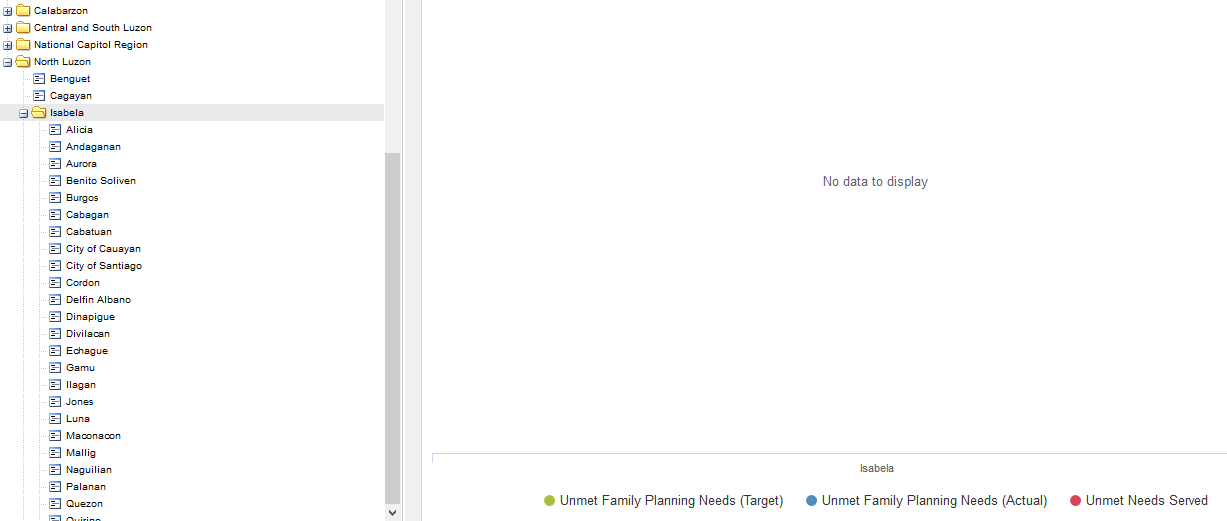
> But when I trying to generate the provincial (example: Isabela), no figure
> is being displayed (see graph below):
>
>
>
>
> My question is, how can the sum of municipalities be displayed when
> generating the graph for the province?
>
> Thank you and any lead information will be highly appreciated.
>
>
>
>
>
> --
> Alison O. Perez
>
> Linkedin Profile: ph.linkedin.com/pub/alison-perez/56/44/a65/
> Website: http://zerepa.net
> Skype / IM: darth_ali
>
> "Daring ideas are like chessmen moved forward; they may be beaten, but
> they
> may start a winning game." -- Johann Wolfgang Goethe*
>
>
>
> _______________________________________________
> Mailing list: https://launchpad.net/~dhis2-users
> Post to     : dhis2-users@xxxxxxxxxxxxxxxxxxx
> Unsubscribe : https://launchpad.net/~dhis2-users
> More help   : https://help.launchpad.net/ListHelp
>
>


References