dhis2-users team mailing list archive
-
 dhis2-users team
-
Mailing list archive
-
Message #07341
Re: Issue with tracker data aggregation in event visualizer and event reports
Hi Randy,
good question. This is in fact partly supported in version 2.19. The
limitation is that you can only aggregate over one data element per report.
In 2.20 we plan to support aggregation of tracker data elements /
attributes similarly to how you can aggregate routine data values.
What you can do in 2.19 or now is to:
- Decide on which data element you want to aggregate (e.g. "Pregnant women
registered")
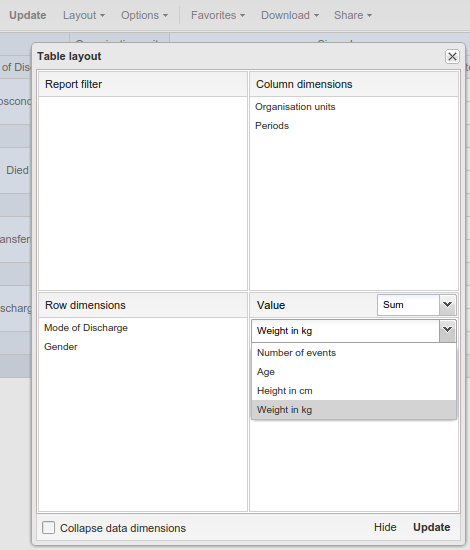
- In event report/visualizer, go to Layout
- In the "Value" area, select "Sum" as aggregation operator, and select
your data element in the value drop-down
- Select the other dimensions you want for your report, e.g. you can have
organisation units on rows and quarterly periods on columns.
The pivot table (or chart) will now show you the sum of "pregnant women
registered" by org unit/quarter.
Just to illustrate the concept have a look at this favorite on demo, which
gives you average weight of patients by quarter and gender:
https://apps.dhis2.org/demo/dhis-web-event-reports/index.html?id=aDrb9UMVxt0
(Click "Layout" to see how to set this up).
Again, we plan to integrate aggregation of tracker data elements /
attributes in the regular pivot table app for 2.20 which will be what you
really need so stay tuned for that.
Screenshot:
[image: Inline image 1]
regards,
Lars
On Fri, Jun 5, 2015 at 11:48 AM, Wilson, Randy <rwilson@xxxxxxx> wrote:
> We have been using the tracker module (multiple events with registration)
> to store imported quarterly data reported by Community Health Workers
> through rapidSMS. These CHWs are registered - and linked to the Health
> Centers that supervise them - then each quarter new datavalues are added
> counting the number of events the CHWs reported (children treated in
> through community case management, pregnant women registered, etc...). We
> couldn't import into the regular datavalue table because there are around
> 1000 reporting CHWs per orgunit per period per dataelement and we didn't
> want to extend the orgunit hierarchy to include 45000 CHWs.
>
> The tracker data elements are numeric and the aggregation type is set to
> sum,
>
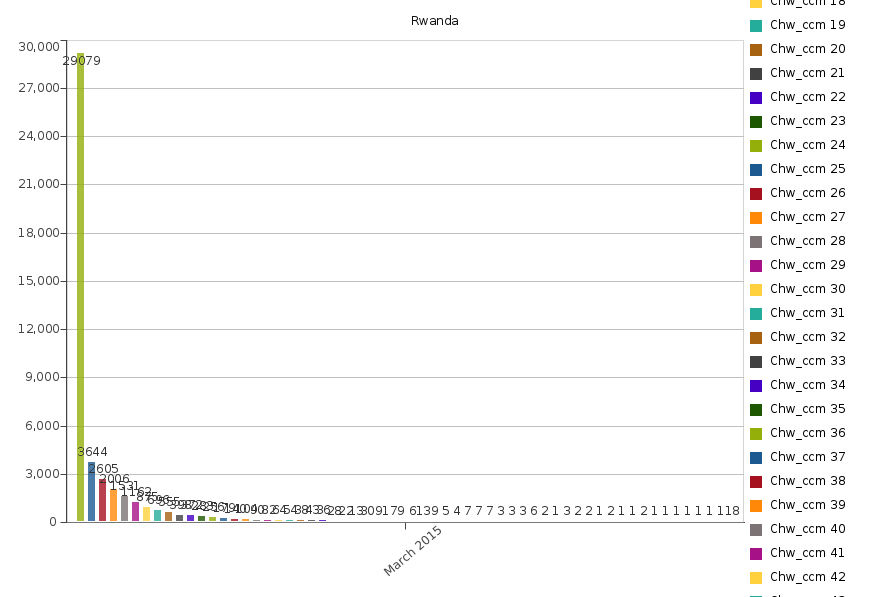
> The imported data displays nicely in the tracker module, however when I
> run an event report or graph, the values are not summed. Instead the
> system produces counts in a frequency distribution like the chart below,
> basically the number of CHWs that reported 1 event, 2 events, 3 events
> etc.....
>
> What we need is a way to display the total number of events reported -
> e.g. total number of children treated, pregnant women registered.
>
> Is this a bug or a feature. Is there some workaround that anyone can
> suggest?
> [image: Inline image 1]
> Thanks,
>
> --
> *Randy Wilson*
> *Team Leader: **Knowledge Management, Data Use and Research*
> Rwanda Health System Strengthening Activity
> Management Sciences for Health
> Rwanda-Kigali
> Direct: +250 788308835
> E-mail: rwilson@xxxxxxx
> Skype: wilsonrandy_us
> <http://www.msh.org/>
> Stronger health systems. Greater health impact.
> <https://www.facebook.com/ManagementSciencesForHealth>
> <https://twitter.com/MSHHealthImpact>
> <https://www.youtube.com/user/MSHHealthImpact>
> www.msh.org
>
> *This message and its attachments are confidential and solely for the
> intended recipients. If received in error, please delete them and notify
> the sender via reply e-mail immediately.*
> _______________________________________________
> Mailing list: https://launchpad.net/~dhis2-users
> Post to : dhis2-users@xxxxxxxxxxxxxxxxxxx
> Unsubscribe : https://launchpad.net/~dhis2-users
> More help : https://help.launchpad.net/ListHelp
>
>
References