dhis2-users team mailing list archive
-
 dhis2-users team
-
Mailing list archive
-
Message #11135
Re: quick GIS question - Heatmap from events
Hi Craig,
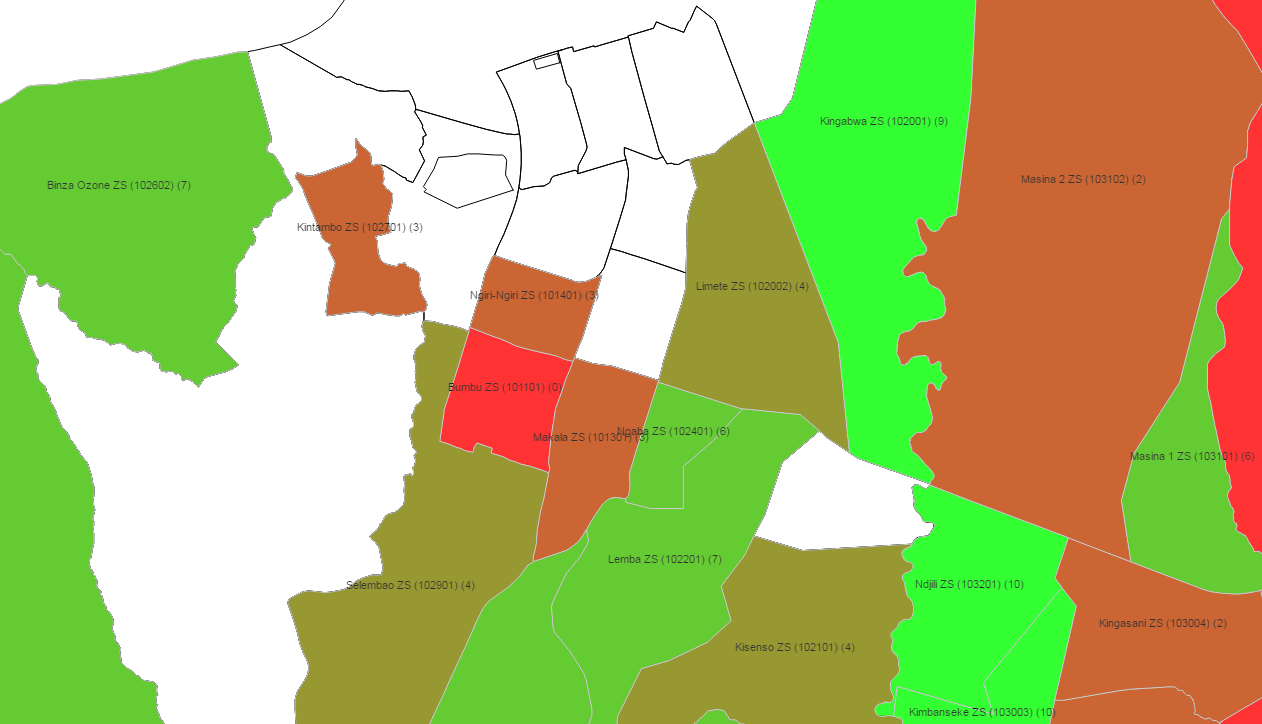
It depends on what type of event data you have: it's possible to create
"heat maps" (with graduated colours for a given admin level) on numeric and
Y/N data elements, but not for others.
You can select Event data items or Program indicators in any of the
Thematic layers (= need to use aggregate, not event layers).
Example below, where colours reflect the number of "Yes" responses to event
data, aggregated by health zone.
Best regards,
Bram
PSI
[image: Inline images 2]
On 18 August 2016 at 14:49, Craig Hollingsworth <craig.hollingsworth@xxxxxx>
wrote:
> Hi,
>
>
>
> Hope all are well.
>
>
>
> Have a quick question. Is it possible, in version 2.23, to make a heat
> map from Event data?
>
>
>
>
>
> Hope someone able to help.
>
>
>
> Craig
>
> _______________________________________________
> Mailing list: https://launchpad.net/~dhis2-users
> Post to : dhis2-users@xxxxxxxxxxxxxxxxxxx
> Unsubscribe : https://launchpad.net/~dhis2-users
> More help : https://help.launchpad.net/ListHelp
>
>
References