dhis2-users team mailing list archive
-
 dhis2-users team
-
Mailing list archive
-
Message #11515
Reporting rate graph does not match report
Hi Everyone
I have a problem.
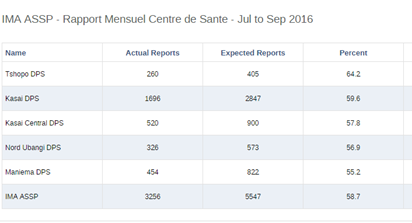
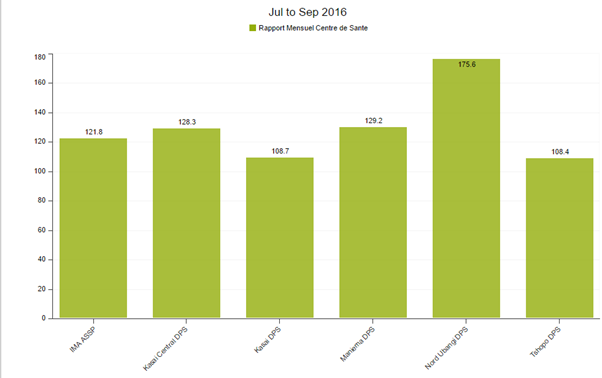
We are looking to present our Reporting Rate for “Rapport Mensuel Centre de
Santé” (Health Center Report) as a graph on the dashboard. Unfortunately,
there is a disconnect between the Reporting rate summary (image 1) and the
graph (image 2).
Image 1
[image: Inline image 1]
Image 2
[image: Inline image 2]
This is my problem, who can help my to fix it?
--
*Carlos Nyembwe*
*I'm just a Computer Scientist*
*Skype: carloscnk1*
*Cell: (+243)813166381*
*Find me in: | Google Plus <https://plus.google.com/+CarlosNyembwe> |
**Linkedin
<http://www.linkedin.com/in/carloscnk> | Facebook
<https://www.facebook.com/carloscnksys> | Twitter
<https://twitter.com/Carlos_CNK> |*
Follow ups