openerp-expert-accounting team mailing list archive
-
 openerp-expert-accounting team
-
Mailing list archive
-
Message #00842
Re: One dashboard defined per application - performance and organisational issue - example
On Thursday 30 September 2010 Ferdinand Gassauer wrote:
> Example
> "Sold Products and Total Price"
> without time selection it
> 1) will select all available data - no one is interested in all sales from
the
> beginning of OpenERP
> 2) will consume considerable time to be generated
> 3) if a company has more than 20 -30 products , the x - axis is likely to be
> unreadable anyhow
>
> I really would appreciate if you could do testing with a full set of data
> (2-3 years )
> with the limited demo data everything "performs" and looks nice
> --
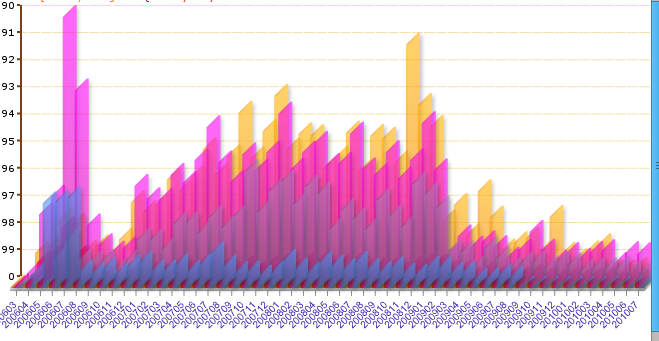
attached you find a graph with period data from ~5 years ~ 60 items on x-axis
which is the abolute max - limit, the tik labels are hardly readable
--
regards
Ferdinand Gassauer
ChriCar Beteiligungs- und Beratungs- GmbH
Official OpenERP Partner
Attachment:
graph_unreadable.png
Description: PNG image
References