dhis2-users team mailing list archive
-
 dhis2-users team
-
Mailing list archive
-
Message #06996
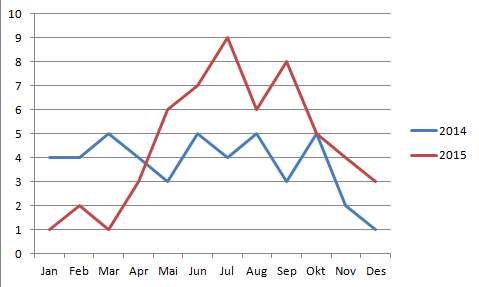
Chart comparing two time intervals
Hi,
a common requirement here at the West African IDSR workshop is to
compare values of one data element/indicator over two time periods,
typically two years as indicated in the attached example. I remember
this being possible in old DHIS->Excel pivot tables when periods were
split in "month" and "year", but with the "Month year" period I don't
see how it can be done in the DHIS. Is there a way to do this, and if
not; can it be considered as a new feature? Not sure how it could be
done, but some ad-hoc creation of time series perhaps. We can always
export it or make custom report, but it seems common enough for IDSR
analysis to be useful on-demand inside DHIS.
Regards,
Johan
Attachment:
example.png
Description: PNG image
Follow ups